
When I first started to get into sim racing, one missing thing was a resource on how to improve sim racing with MoTec data. So I thought I would write out as much as possible to help others get to know MoTec and how it can be used. I will start by explaining what MoTec is, show you how to load your log files, and explain with examples how to compare laps between data files.
What is MoTec Data?
MoTec is a company that makes various real-world racing tools and software. In sim racing, MoTec universally refers to the i2 Data Analysis Software. There are two versions of the software, standard, and pro. Different sims will save their data in one or the other. For example, ACC saves MoTec data as the pro version and does this without any need for plugins. Rfactor 2 requires a plugin to be installed, and it saves it as a standard version. iRacing stores telemetry as an iRacing-specific format that can be converted using MU software.
Loading Your First File
I recommend downloading the pro version of the i2 Data software. After you download and install the software, we need to get the log file to load up. Many coaching sites have a paid service where you can get the data of a pro’s hot lap. In reality, you can simply jump on a track with a teammate, enable telemetry, turn a few laps, and compare log files. ACC has this feature by default and you can find the telemetry logging under the electronics section of your setup. Once you log some laps, the file is saved to “My Documents->Assetto Corsa Competizione->Motec.” Once you have your file(s), simply double-click one to open your workspace. You’ll be greeted with the following UI:
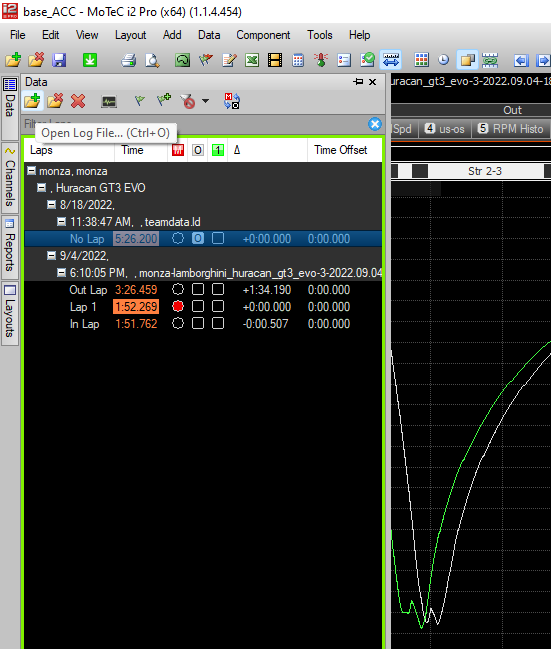
After loading the file, you can click data from the left side menu and click the folder with the plus sign. You can add other log files that will let compare multiple drivers or laps on one screen. In this case, I have two log files from my teammate and myself. Notice the red dot in the second section is marked and the second box is checked at the top, next to “No Lap”. Each one of those is a different lap.
Analyzing The Data
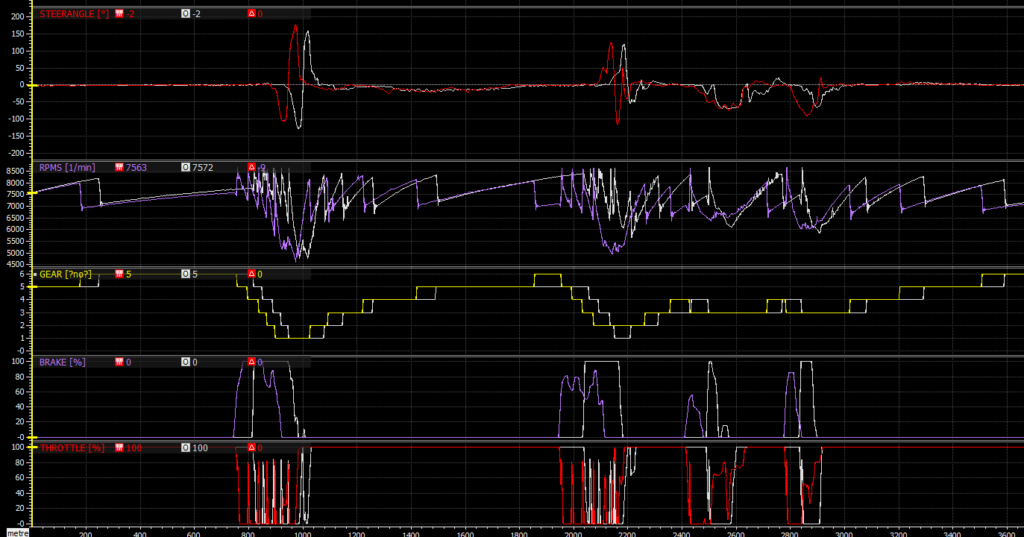
The above data shows two laps, represented by two lines in each section. The red and purple lines are my data, and the white is my teammate’s data. The final times were .8 (eight tenths) of a second off one another. Why? I have zoomed in on the first sector, and we can immediately see one of the culprits, early braking. The purple line immediately spikes nearly 50 meters earlier than the fastest lap. I know that my braking point is the 150-meter sign at Monza; I now have the exact distance that I need to drive deeper before braking. Push the braking point further, and the lap time should come closer to my teammate’s time.
Recognizing Patterns In MoTec Data
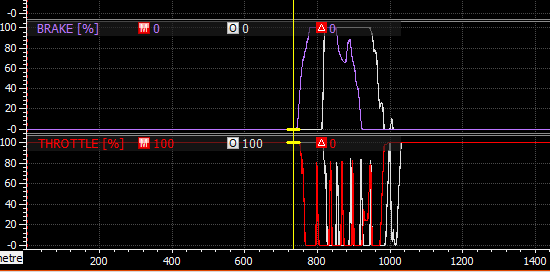
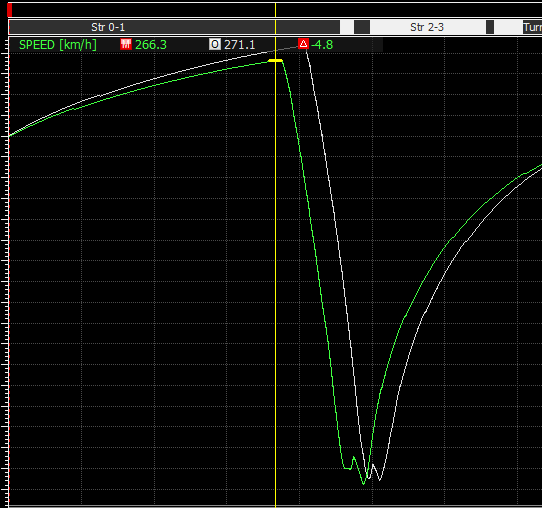
The above figure shows the turn one at Monza. When braking, you want to see a bell curve without spikes. A spike indicates that too much speed was being carried, and brakes had to be applied again. Notice how the white line has no spikes, yet the purple has a spike in the middle of the turn. This is not surprising because turn one is a chicane. The problem is the result of that simple different results in a significant difference, as shown in the next figure.
Conclusion
MoTec is a company that produces data analytic solutions for motorsports. Sim racers use i2 Data to analyze their laps and compare them to each other to improve. In my example, I could see that my braking point for turn 1 was significantly different than my teammates. The result was a 5 km/h difference in speed entering the corner. If you want to use MoTec data without a teammate, you can use it to help you master cornering by reading out common cornering mistakes posts and reviewing data to improve.